Sales Velocity: What It Is, How to Calculate It, and How to Improve It
Sales velocity measures how fast your pipeline turns into revenue: here is the formula, the four levers that drive it, and how small teams can improve it quickly.

Sales Velocity: What It Is, How to Calculate It, and How to Improve It
Sales velocity is the rate at which your pipeline generates revenue over time. Not how much pipeline you have. Not how many deals you closed last quarter. Specifically: how fast does a qualified opportunity turn into money in the bank?
For most sales teams, this number is invisible. Reps know their quota and their close rate, managers know their pipeline coverage, but almost nobody tracks how quickly that pipeline actually moves. That gap is expensive.
Understanding sales velocity gives you a single diagnostic number that reflects the health of your entire sales process. When it drops, something has changed. When it climbs, something is working. The metric forces clarity in a way that headline revenue figures usually do not.
Sales Velocity Defined
Sales velocity is a measure of the revenue your sales team generates per unit of time. Most commonly expressed per day, though some teams calculate it per week or per month depending on their cycle length.
The core idea is simple: a deal worth $50,000 that closes in 30 days is worth more to your business than a deal worth $60,000 that takes 90 days. The longer deal ties up rep time, carries more risk of falling through, and delays cash in ways that affect your ability to hire and invest. Sales velocity captures that difference.
What makes it particularly useful is that it surfaces the interaction between four variables that every sales leader already tracks separately: the number of deals in your pipeline, your average deal size, your win rate, and your average sales cycle length. Sales velocity combines all four into one number. If any of those variables shifts, the number moves, and you know immediately where to look.
This is not a vanity metric. It is a diagnostic one. Teams that track sales tracking metrics well know the difference: some numbers describe an outcome, others help you understand what caused it. Sales velocity is the latter.
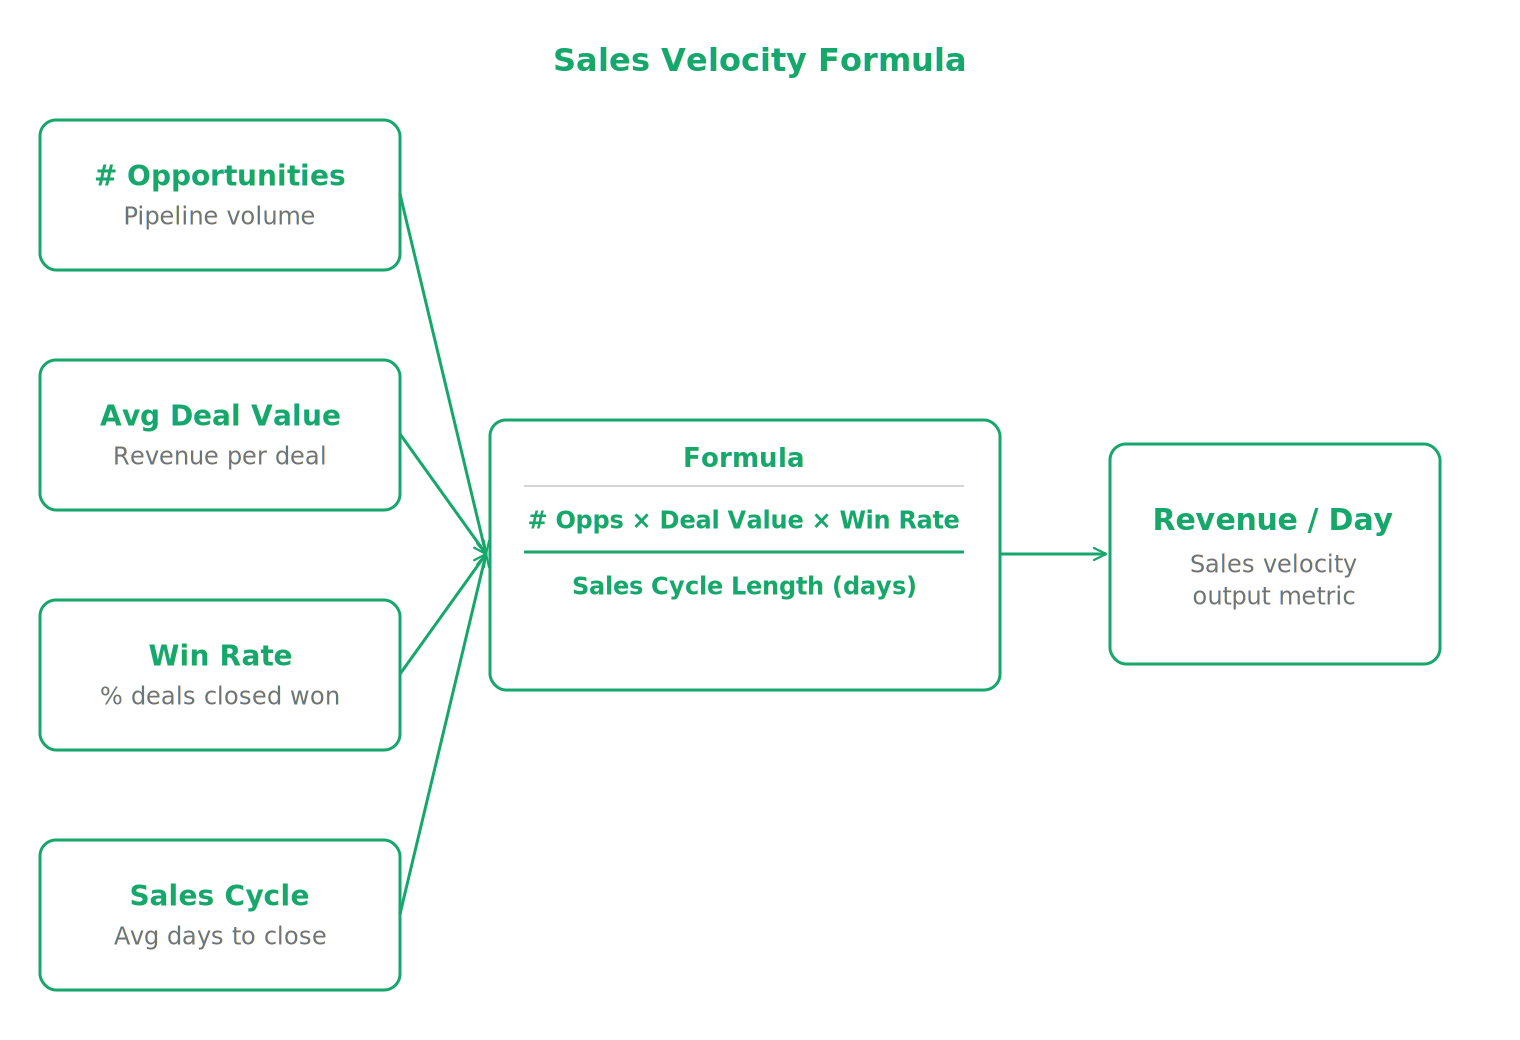
The Sales Velocity Formula
The formula has four inputs:
Sales Velocity = (Number of Opportunities × Average Deal Value × Win Rate) ÷ Average Sales Cycle Length
A worked example makes this concrete. Say your team has 50 qualified opportunities in the pipeline, your average deal is $8,000, your win rate is 25%, and your average sales cycle is 40 days.
(50 × $8,000 × 0.25) ÷ 40 = $100,000 ÷ 40 = $2,500 per day
That means, on average, your team is generating $2,500 in new revenue every day your pipeline is active. Over a full quarter (roughly 65 selling days), that produces approximately $162,500 in closed revenue.
A few things worth noting about how to apply this formula correctly.
First, only count qualified opportunities, not everything that enters the top of your funnel. Inflating the numerator with unqualified leads makes the number misleading and masks the real state of your pipeline.
Second, use the actual sales cycle length from your CRM data rather than a gut estimate. Most teams discover their real cycle is longer than they thought when they pull the numbers for the first time.
Third, calculate this number per segment if your deal sizes or buyer types vary significantly. A formula that averages across your enterprise deals and your SMB deals will give you a number that does not accurately describe either.
What Drives Sales Velocity: The Four Levers
Because the formula has four variables, you have four levers to pull. Each one works differently, and not all of them are equally accessible depending on where your team is right now.
Lever 1: Number of Opportunities. More qualified deals in the pipeline means more velocity, assuming the other variables stay constant. The trap here is treating this lever as the obvious answer and defaulting to "generate more leads." Volume only helps if the incoming deals are genuinely qualified. Adding 20 weak opportunities that each take twice as long to work and close at half the rate will hurt your velocity, not help it.
Prospecting discipline matters more than prospecting volume. A tighter ICP, better intent signals, and more careful qualification at entry all compound over time. If you want to understand how prospecting connects to pipeline quality, building a sales pipeline from scratch covers the mechanics of that decision.
Lever 2: Average Deal Value. Increasing the size of the deals you close directly increases velocity without requiring more pipeline or faster cycles. Practically, this comes from better qualification (finding buyers with larger budgets), more consistent upsell behavior early in the process, and multi-stakeholder deals where you're solving a problem for a team rather than an individual.
This lever takes longer to move than it looks, because it requires changes to ICP targeting and rep behavior, not just pricing decisions.
Lever 3: Win Rate. Win rate improvements have a multiplicative effect on the formula. Going from 25% to 30% does not sound dramatic, but it represents a 20% increase in revenue from exactly the same pipeline volume and cycle length. Win rate is usually a rep skill and process problem. Are reps qualifying out of bad fits early? Are proposals going to the right stakeholders? Are objections being addressed before the final call?
This is where sales coaching, better call intelligence, and pipeline management data create the most leverage. If your win rate varies significantly by rep, that variance is almost always diagnostic of something specific and fixable.
Lever 4: Average Sales Cycle Length. Shortening the cycle is the denominator lever: every day you cut from the average cycle increases the daily velocity figure. Common sources of cycle drag include: delayed follow-up after meetings, long gaps between stakeholder conversations, proposals sitting without nudges, and unclear next steps agreed at each stage.
A lot of cycle length is actually idle time, not active time. Deals are not being worked for 40 days; they are moving for 8 days and sitting dormant for 32. Follow-up cadence and response time matter more than most teams acknowledge. Getting back to a prospect within two hours rather than 48 is a cycle-length intervention as much as it is a relationship one.
What Actually Drives Velocity Differences
Honestly, published benchmarks for sales velocity are difficult to trust. The formula combines four variables, each of which varies enormously by company stage, deal size, and sales motion. A $10,000 ACV SaaS company and a $200,000 ACV enterprise software company will have radically different velocity numbers, and comparing them directly tells you almost nothing.
That said, there are useful reference ranges for each input variable that can help you diagnose whether your components are in a reasonable range.
For win rates, 20-30% is common for outbound-sourced pipeline in B2B SaaS. Inbound pipeline typically runs higher, often 30-45%. Professional services deals tend to have wider variance depending on how competitive the pitch environment is.
For sales cycle length, SMB SaaS averages somewhere between 14 and 40 days for deals under $20K ACV. Mid-market deals in the $20K-$100K range typically run 45-90 days. Enterprise deals above $100K often exceed 90 days and can stretch to 6+ months, particularly where procurement or legal review is involved.
For average deal size, the only number that matters is yours versus your prior periods. Are deals getting larger as you move upmarket? Are they shrinking as competitive pressure increases? The trend is the signal.
The more productive benchmark is your own historical data. Calculate your velocity for last quarter, compare it to two quarters ago, and interrogate the difference. If velocity dropped, which of the four inputs moved? That question is almost always answerable with your CRM data and it points directly at the problem.
How to Increase Sales Velocity for Small Teams
Small teams have a specific constraint: you cannot pull all four levers at once. There is not enough capacity, and trying to optimize four variables simultaneously usually means optimizing none of them well. So the first step is diagnosing which lever has the most available headroom.
If your win rate is already above 30% but your cycle is consistently long, the cycle-length lever is your priority. If your cycle is short but win rate is below 20%, that is a qualification and sales process problem. If both are reasonable but pipeline volume is thin, prospecting discipline is the bottleneck.
Start with this sequence:
- Pull your current velocity number from the last 90 days of closed deals. If your CRM does not spit this out directly, calculate it manually from pipeline reports.
- Compare the four inputs to the same period last year or two quarters ago. Identify which variable has moved most.
- Pick the one lever with the most headroom and run a 30-day focused improvement experiment. Not four experiments. One.
The single most underrated intervention for small teams is follow-up consistency. Most deals that should close do not close because they fall into the follow-up gap. A prospect expresses interest, gets a proposal, and then hears nothing for ten days because the rep was busy. That idle time adds days to every deal in your pipeline and quietly kills win rate on deals that would have closed if someone had followed up on day three.
For teams using a CRM with workflow automation, this is solvable. A simple trigger that creates a follow-up task when a deal has been in a stage for more than three days eliminates most of the idle time without requiring rep discipline to change. This is the kind of automation described in small business automation priorities that pays off immediately.
The second intervention is qualification tightening. If you are carrying deals in your pipeline that have no realistic chance of closing this quarter, they are dragging your cycle length number and distorting your forecast. A bi-weekly pipeline hygiene review to remove or requalify stale opportunities keeps your velocity number honest and keeps rep attention focused on winnable deals. Consistent pipeline coverage tracking makes this review significantly faster.
For teams using a platform like Dalil, the Analytics feature gives you the drill-down pipeline data needed to calculate and track velocity components without manual spreadsheet work. Click any metric and you get the underlying deals, not just a summary number. That level of detail is what makes the velocity diagnostic useful in practice rather than theoretical.
There are only two root causes of a declining sales velocity: a math problem or a strategy problem. Either the inputs are too low (volume, deal size, win rate) or the approach is wrong (wrong ICP, weak messaging, broken follow-up). Tracking velocity tells you which category your problem sits in. Knowing which problem you have is most of the diagnostic work.
FAQ Section
What is a good sales velocity? There is no universal benchmark because the number depends entirely on your deal size, cycle length, and market. A good sales velocity is one that is higher than your previous period and sufficient to hit quota at your current pipeline volume. Calculate your own baseline and measure improvement against it.
How do you calculate sales velocity? Multiply the number of qualified opportunities by your average deal value and your win rate, then divide by your average sales cycle length in days. The result is your revenue generated per day. For example, 50 opportunities × $8,000 × 0.25 win rate ÷ 40 days = $2,500 per day.
What is the difference between sales velocity and sales cycle length? Sales cycle length is a single input into the velocity formula. It measures how long your average deal takes from qualified opportunity to close. Sales velocity combines cycle length with three other variables to produce a revenue-per-day figure. A short cycle length helps velocity, but a very short cycle with a low win rate can still produce poor velocity.
How does CRM help improve sales velocity? A CRM improves velocity in two ways: by giving you accurate data on each of the four variables so you know which lever to pull, and by automating follow-up and stage-progression tasks so deals move faster without depending on rep memory. The practical gains come from knowing which deals have been sitting too long and making sure nothing falls into the follow-up gap.
More from the blog

Sales Prospecting Tools: The Complete Buyer's Guide for B2B Teams
A practical buyer's guide to sales prospecting tools for B2B teams, covering tool categories, AI capabilities, budget stacks, and how to avoid the trap of over-tooling before fixing your process.

CRM for Manufacturing: Why Manufacturers Need a CRM and How to Choose One
A practical guide to choosing a CRM for manufacturing, covering why long B2B sales cycles demand proper pipeline visibility, which features actually matter, and how to avoid the most common implementation mistakes.

What CRM Do SDR Teams Actually Like Using? A Practical Guide
A practical guide to CRM selection for SDR teams, covering the features reps actually use, why most CRMs create friction instead of removing it, and how AI is changing the admin equation.